UPDATED: A FOIA request came in for Nova Scotia
Here's what it showed.

by Jessica Rose
Please refer to the recently FOIAed document received from the Nova Scotia Office of the Deputy Minister Health and Wellness Department. There they go again with that fast and loose use of the word ‘Health’. It is dated June 1, 2022. Thank you to the person who made this request.
The document shows that COVID-19 injectable product use has a dose response: more doses = more cases = more hospitalizations = more deaths, in a nutshell.
See the following bar graphs I transcribed from their .pdf Tables listed in the document. I normalized the data according to absolute number per 100,000 in each respective 0, 1, 2 and >=3 dose populations based on world population review data for Canadian provinces (Nova Scotia).1
Let’s count ‘cases’ as a marker of effectiveness of the products. If these COVID-19 injectable products were effective at lowering transmission rates, then the frequency of reporting of cases would decrease with increasing distribution of the products. We can see in Figure 1a (from the absolute counts from this Freedom of Information Requested - NOT offered freely for the public to see) data, that the frequency of case reports is proportionally related to the dose → more doses = more cases. This is the definition of an ineffective product with regard to reduction of transmission and is a FAILED ‘VACCINE’. But we need to check the normalized charts as well.
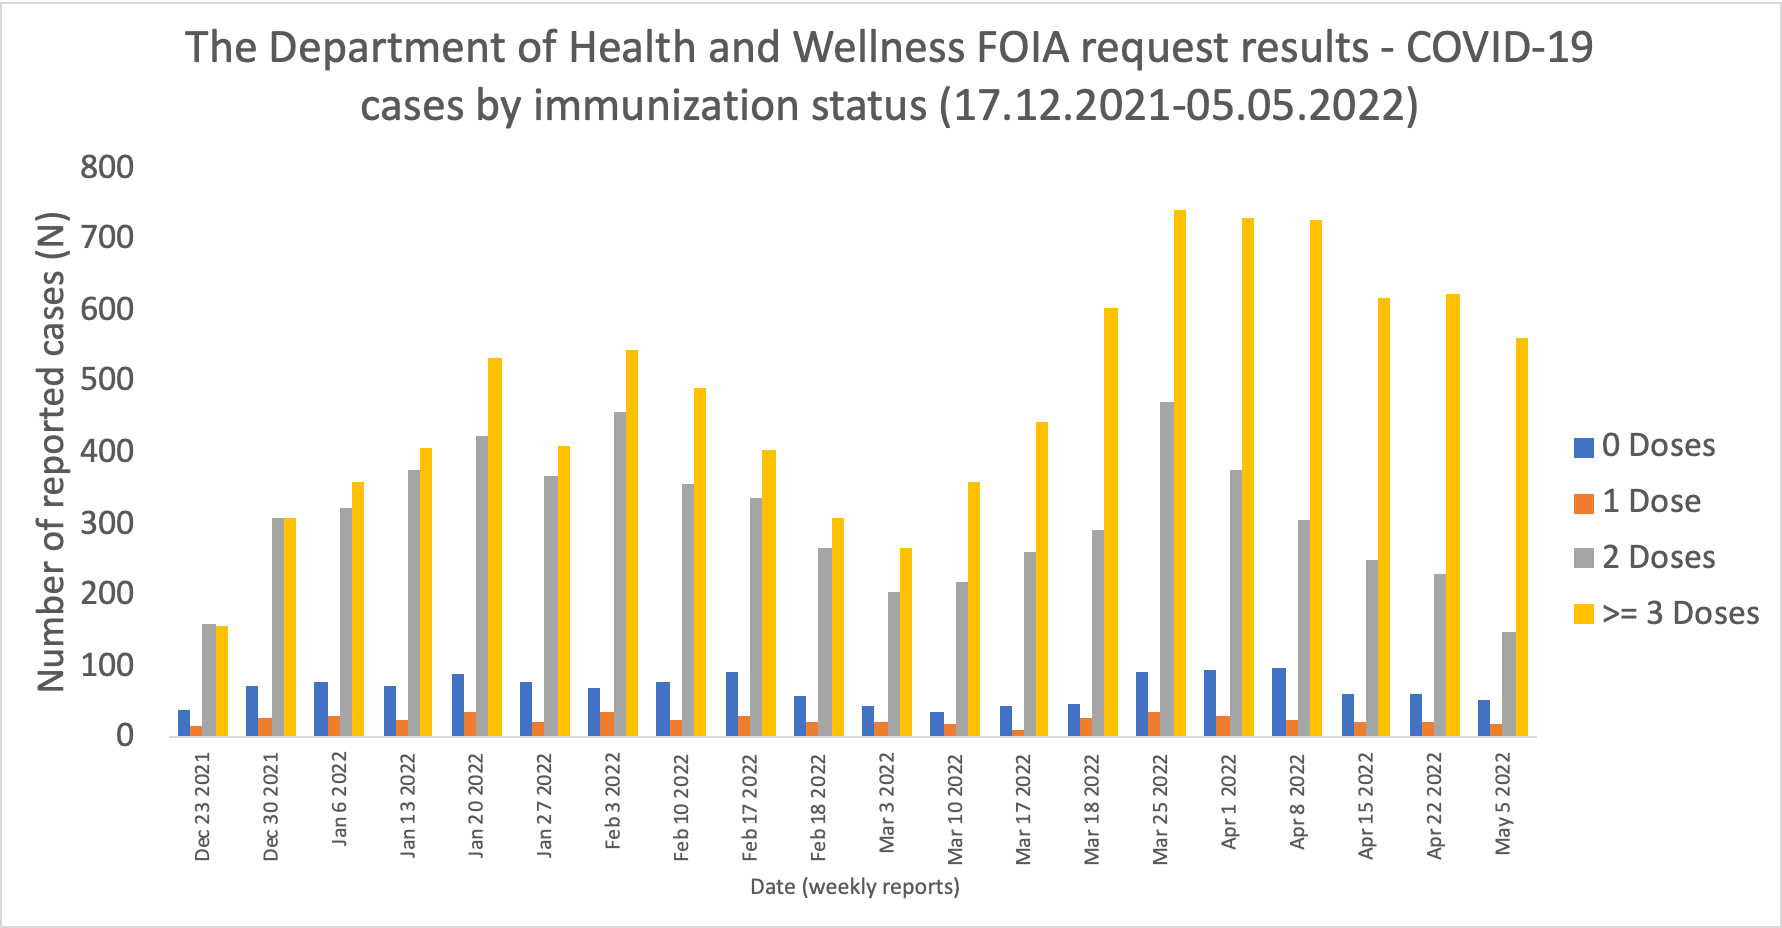
Figure 1b shows the normalized data - a very quick and dirty normalization - the population of Nova Scotia is estimated to be ~992,000 where ~90%, 85% and 50% are 1, 2 and >=3 dosers. Even though the relative rates for 0 dosers are higher than the 1 and 2 dosers by comparison, the rates per 100,000 3 dosers remain highest of all groups starting March 3, 2022. So yes, these are ineffective products with regard to reduction of transmission according to this data.

What was it you said? Injected individuals are 95% less likely to get COVID-19 over uninjected individuals? How many ways can I say this: you were wrong. Damage control this. The data is clear.
Let’s count ‘hospitalizations’ as effectiveness as well but this time, let’s use it to assess whether or not the COVID-19 injections reduced the likelihood of ending up in the hospital. Figure 2a shows that the absolute counts of hospitalizations are proportionally related to dose → more doses = more hospitalizations. This is the definition of an ineffective product with regard to a reduction in severity of symptoms and is a FAILED ‘VACCINE’. But we need to normalize the data to definitively draw this conclusion, don’t we?

When the data is normalized per 100,000, it appears as though the individuals who are being hospitalized with the highest frequency are the no dosers. Now let me be very clear here. I calculated the ratio of hospitalizations/100,000 individuals who were uninjected: the 10% or so of the population of Nova Scotia who didn’t get jabbed, assuming that the absolute counts of the 0 dosers who were hospitalized were actually 0 dosers and not people who had been injected and simply in that ‘special’ 14-day period following dose 1 when they are considered to be ‘unvaccinated’.

The most recent hospitalization rates (May 5, 2022) are pretty much equal when comparing the 0 and 3 dosers. I would say, based on this data, the 1 dosers win and that we should keep a close eye on how this pans out in the coming months. But, it makes me wonder, what of pre-existing immunity prior to injection? Where is that data? Do these 1 dosers just appear to win out because of pre-existing immunity?
Let’s count ‘deaths’ as the worst outcome of a product that is meant to promote longevity, vitality and health. What we see from the absolute counts, (note that the death data is more sparsely populated that the case and hospitalization data), is that the number of deaths is proportionally related to dose → more doses = more deaths.
N.B. The deaths in the uninjected individuals in early 2022 are likely the elderly. I don’t have the data stratified by age, so that’s just a guess. But you’ll also notice that the deaths in the uninjected group wanes as time is passing. It appears as though death counts are also starting to go down in the 3 dosers. It will be interesting to see what the numbers look like at the end of 2022. Let’s normalize.

When the data is normalized for deaths, again the adjusted data shows that the 0 dosers are reporting more deaths from COVID-19 in the beginning of 2022 until about mid-March. Sparse data, don’t forget. And perhaps, again, the 0 dosers are actually 1 dosers.

From March 18, it appears as though the number of individuals reported to be dying from COVID-19 with highest frequency are the 3 dosers. I would take this result with a grain of salt - we need more, and reliable, death data. Again, it will be very interesting to see how this plays out in the coming months. I would still call this a failed product. I always will. I would also point out here that I usually don’t touch data that involves ‘cases’ and ‘deaths’ with a 10-foot pole because I think it’s all flawed since a ‘case’ is defined by PCR and this DNA amplification technique is done more for people who are NOT injected, in many cases. And deaths, well, reassessment of death certificates have resulted in many back tracks of those numbers. Many individuals who presumably died ‘from’ COVID-19 actually died ‘with’ COVID-19. So, there’s that grain of sodium chloride again.
In any and all cases, it is up to the individual if they want to be a 0, 1, 2 or a 3!
These data contradict the efficacy claims and expletives being repeated over and over again by the FDA and the CDC: these products are NOT EFFECTIVE and NOT SAFE (not necessarily based on this data - you need adverse event data for that).
I will ALWAYS choose natural immunity.
Here’s a slide I made that omits the 0 dosers. I made it just to better compare the data from the dosers. I think it’s better to compare the dose data since I believe the 0 dose data is not actually 0 dose data: I think it’s 1 doser data.Anyway, I’m staying away from case and death data from now on. It’s too floopy.
1 https://worldpopulationreview.com/canadian-provinces/nova-scotia-population
Expect year over year (YoY) Canadian mortality increase for 2021 to be far greater than year of the “pandemic” 2020 YoY mortality increase which came in at 0.04%, which was same increases for non “pandemic” years 2018 and 2019.
All-cause mortality since the DEATHVAX™ rollout has surged as per life insurance companies’ reports and increased payouts.
The above data further corroborates all of this substack’s warnings about the PSYOP-19 depopulation and control program.
There are no coincidences here, just like SADS is a marketing term to coverup the slow kill bioweapon injection deaths.
This has all been carefully planned and coordinated by the One World Government for decades as per their many white papers.
This is a globally coordinated eugenics Great Reset power grab with large swaths of the population brainwashed into believing that they are the scourge of humanity as a direct function of their own anthropogenic “climate change” we well as other virtue signal leveraged behavioral psychology games such that the uptake of deadly injectables is in turn leveraged by emotions, “Trust the Science” and other anti-science Statist-Corp mind tricks.
Do NOT comply.
Stuff like this tells me that hell is real. There has to be cosmic justice for treating your fellow man this badly...
The vaxxed are gonna take a toll on purebloods every possible way.
They were lazy, cowardly, unthinking....
They gave up their freedoms, so we are gonna have to fight very hard for them.
My life insurance premiums will be going out to pay Their survivors.
I have no ides about shedding, but if true another way.