Fully Vaccinated Young Adults suffer 73% increase in Heart Attacks & Strokes and 92% higher Mortality Rate compared to Unvaccinated
And it will only get worse over time as per rising all-cause mortality trends.
by THE EXPOSÉ
Official figures show there has been a 67% increase compared to the historical average in the number of people aged 15 to 44 suffering heart attacks, cardiac arrest, myocarditis, stroke, and other cardiovascular diseases since this age group was first offered the Covid-19 injection in Scotland.
And further analysis shows this issue is actually getting worse, with the numbers for 2022 so far revealing a 73% increase against the historical average.
Meanwhile, data published by the Office for National Statistics show that between January 2021 and January 2022, double vaccinated 18 to 39-year-olds in England were on average 92% more likely to die than unvaccinated young adults of the same age.
This is either a terrible coincidence or the smoking gun that proves the damage the Covid-19 injections have done and are doing to the population.
It is now well known that a possible severe consequence of getting the Covid-19 injection is that one may develop either myocarditis or pericarditis, or in some cases both. We know this because the authorities have had to admit it occurs, although as expected have downplayed it as extremely rare. This probably means it is much more common than people realise.
In simple terms, myocarditis is an autoimmune disease that causes inflammation of the heart muscle. This inflammation enlarges and weakens the heart, creates scar tissue and forces it to work harder to circulate blood and oxygen throughout the body. (source)
Whilst Pericarditis is an autoimmune disease causing inflammation of the pericardium, a sac-like structure with two thin layers of tissue that surround the heart to hold it in place and help it work.
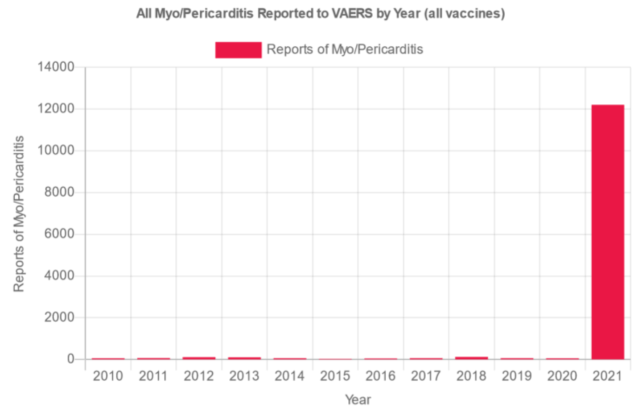
Here’s how both autoimmune diseases have affected people in the USA according to the Vaccine Adverse Event Reporting System (VAERS), where just 1-10% of adverse reactions are actually reported [2SG: as per large Harvard study reporting to VAERS was discovered to be under 1%.] -
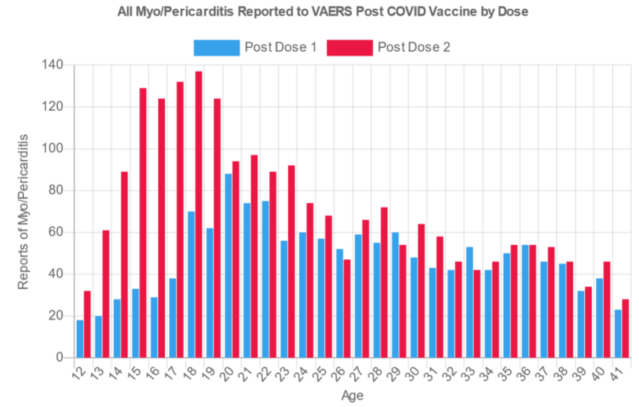
Here’s how those unprecedented amounts of cases of myo/pericarditis reported to VAERS have been distributed by age –
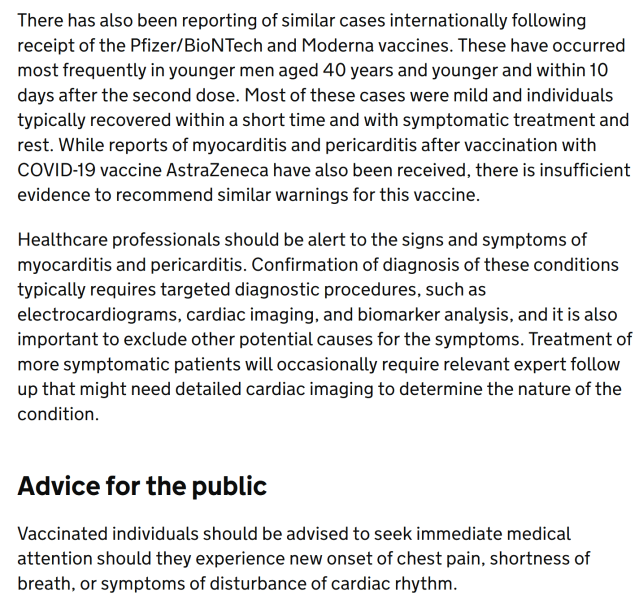
As you can clearly see, the two autoimmune conditions are much more likely to occur in younger age groups, and the UK Medicine Regulator has admitted this is the case –
You may have noticed how the UK Medicine Regulator, the MHRA, stated how “most of these cases [of Myocarditis] were mild”. So nothing to worry about then? Unfortunately not.
A mild case of myocarditis or pericarditis does not exist. You only get one heart, and it is incapable of regenerating/ repairing once damage has been done. Ongoing cardiovascular medication or even a heart transplant may be needed.
Overall, myocarditis which can cause dilated cardiomyopathy, is thought to account for up to 45 percent of heart transplants in the U.S. today. (source)
Myocarditis can permanently damage your heart muscle, possibly causing:
Heart failure. Untreated, myocarditis can damage your heart’s muscle so that it can’t pump blood effectively. In severe cases, myocarditis-related heart failure may require a ventricular assist device or a heart transplant.
Heart attack or stroke. If your heart’s muscle is injured and can’t pump blood, the blood that collects in your heart can form clots. If a clot blocks one of your heart’s arteries, you can have a heart attack. If a blood clot in your heart travels to an artery leading to your brain, you can have a stroke.
Rapid or irregular heart rhythms (arrhythmias). Damage to your heart muscle can cause an arrhythmia.
Sudden cardiac death. Certain serious arrhythmias can cause your heart to stop beating (sudden cardiac arrest). It’s deadly if not treated immediately.
[2SG: Myocarditis decreases lifespan for all sufferers, and in many cases significantly decreases lifespan; a child’s life expectancy with myocarditis is around 10 years from diagnosis.]
With all that being said the following data that has been published by Public Health Scotland should come as no surprise.
Public Health Scotland (PHS) has a not very well known database presenting figures on the wider impact to the health service due to measures imposed in the name of Covid-19. The database is called ‘COVID-19 wider impacts on the health care system‘.
We have previously researched the data contained within the database to reveal a huge upsurge in cases of ovarian cancer across Scotland since the introduction of the Covid-19 injections. It just so happens that a study conducted by Pfizer reveals the mRNA Covid-19 injection accumulates in the ovaries.
But this time we decided to analyse the data for cardiovascular cases across Scotland. Cardiovascular diseases are conditions that affect the structures or function of your heart, such as:
Abnormal heart rhythms, or arrhythmias
Coronary artery disease (narrowing of the arteries)
Heart muscle disease (cardiomyopathy)
Myocarditis
Peripheral vascular disease
Vascular disease (blood vessel disease)
For the ‘out of hours’ category, and the ‘ambulance service’ category, PHS provides a breakdown by age. Meaning we can assess the number of cardiovascular cases among adults aged 15 to 44.
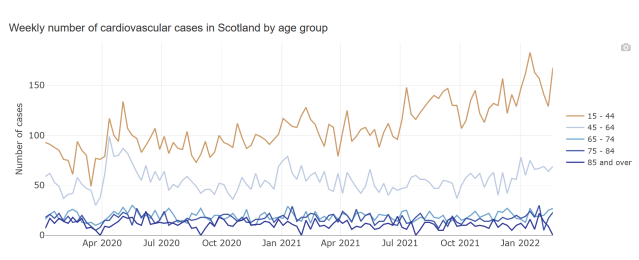
Here is how Public Health Scotland present the data on the number of cases requiring out-of-hours care across Scotland –
As you can see from the above the weekly number of cases has been highest among 15-44-year-olds since the beginning of the pandemic, but that gap between all other age groups suddenly got much bigger in 2021.
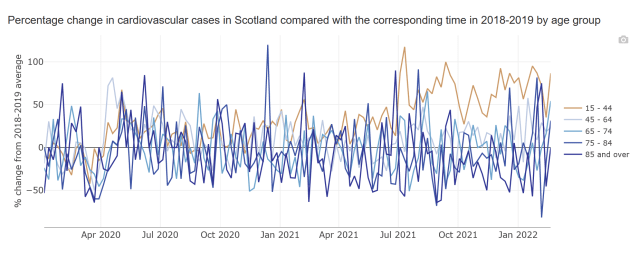
This is confirmed by the second graph above which shows the percentage change in cardiovascular cases against the 2018-2019 historical average. From around July 2021 there has been a huge spike in cardiovascular cases among 15-44-year-olds that should set alarm bells ringing and deserves further attention. So that’s exactly what we gave it.
We extracted the data and produced a series of charts in order to present the figures provided by Public Health Scotland much more clearly and to attempt to understand the severity of what has been occurring since the introduction of the Covid-19 injections.
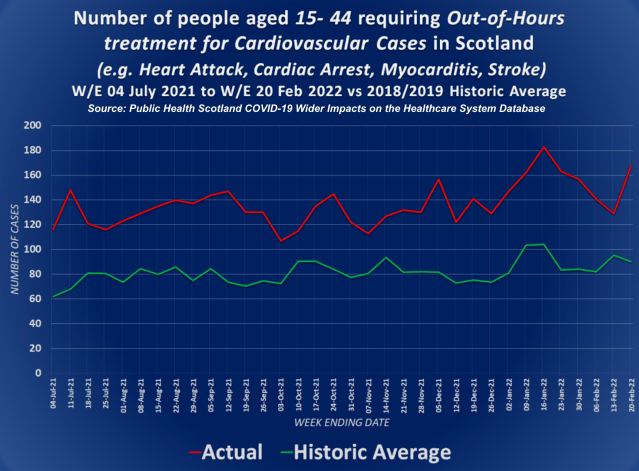
The following chart shows the number of people aged 15-44 requiring out-of-hours treatment for cardiovascular cases per week from the week ending 4th July 2021 to the week ending 20th Feb 2022, as well as the 2018-2019 historical average per week among the same age group –
The historical average shows that there have been anywhere from around 60 to just over 100 cardiovascular cases among 15 to 44-year-olds requiring out-of-hours treatment across Scotland. But the data for 2021 and 2022 shows that there have been anywhere from around 110 cases to 185 cardiovascular cases among 15 to 44-year-olds requiring out-of-hours treatment.
So the number of cases have essentially doubled.
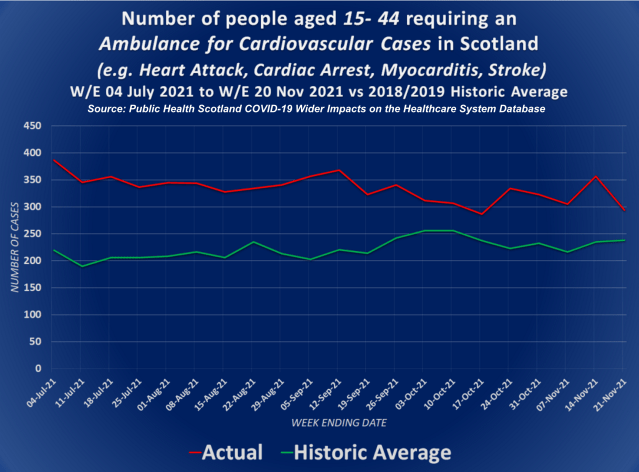
The following chart shows the number of people aged 15-44 requiring an ambulance for cardiovascular cases per week from the week ending 4th July 2021 to the week ending 21st November 2021 (the most up to date data), as well as the 2018-2019 historical average per week among the same age group –
The historical average shows that there have been anywhere from around 185 to just over 250 people aged 15-44 requiring an ambulance for cardiovascular cases per week across Scotland. But the data for 2021 and 2022 shows that there have been anywhere from around 290 cases to 390 people aged 15-44 requiring an ambulance for cardiovascular cases per week.
So cases haven’t quite doubled but they’ve still increased quite dramatically.
The following chart shows percentage change in the number of people aged 15-44 requiring out-of-hours treatment for cardiovascular cases per week from the week ending 4th July 2021 to the week ending 20th Feb 2022, compared to the 2018-2019 historical average per week among the same age group –
Here we can see that the number of cases requiring out-of-hours care has been higher throughout this entire period, ranging from a 35% increase in a single week to a staggering 117% increase in a single week compared to the historical average.
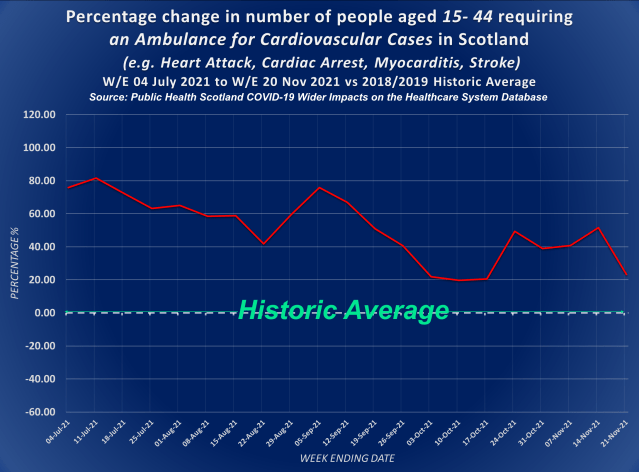
The following chart shows the percentage change in the number of people aged 15-44 requiring an ambulance for cardiovascular cases per week from the week ending 4th July 2021 to the week ending 21st November 2021 2018-2019 , compared to the historical average per week among the same age group –
Again we can see that the number of 15 to 44-year-olds requiring an ambulance has been higher than the historical average throughout the entire period, ranging from a 23% increase in a single week to an 82% increase compared to the historical average.
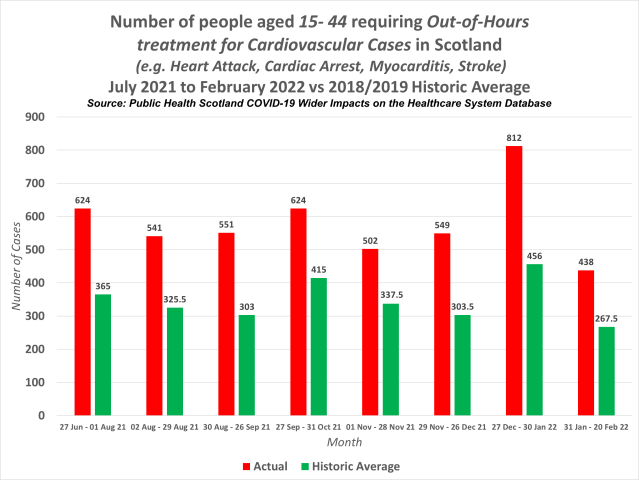
The following chart shows the number of people aged 15-44 requiring out-of-hours treatment for cardiovascular cases per month from July 2021 to February 2022, as well as the 2018-2019 historical average per month among the same age group –
January has seen the most cases both historically and in 2022, but the difference here is that 2022 saw a 78.07% increase on the historical average, this was not however the worst increase seen since July 2021.
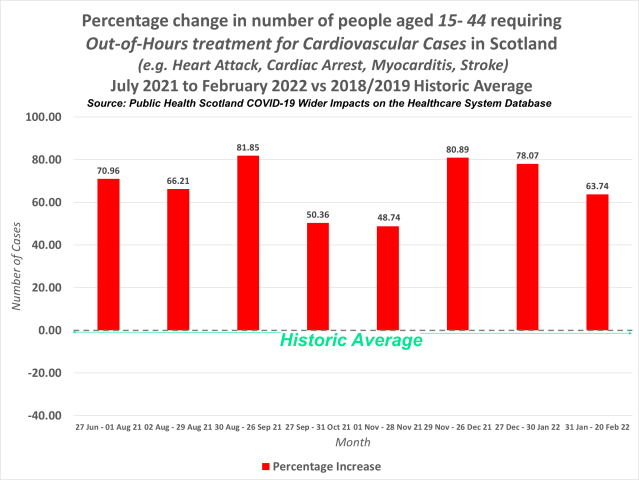
The following chart shows the percentage change in the number of people aged 15-44 requiring out-of-hours treatment for cardiovascular cases per month from July 2021 to February 2022, as well as the 2018-2019 historical average per month among the same age group –
The biggest increase was actually recorded in September 2021, with a 82% increase recorded against the historical average. This was closely followed by December 2021 with an 81% increase against the historical average. The smallest increases were recorded in both October and November 2021, but these months still saw a 50% and 49% increase against the historical average.
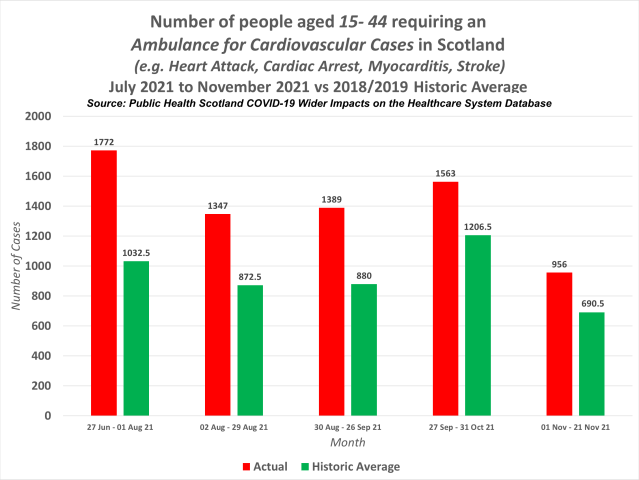
The following chart shows the number of people aged 15-44 requiring an ambulance for cardiovascular cases per month from July 2021 to February 2022, as well as the 2018-2019 historical average per month among the same age group –
June 2021 saw the most people aged 15-44 requiring an ambulance due to an issue such as suffering a heart attack, cardiac arrest, myocarditis, or stroke with 1,772 cases. But the historical average shows that October is usually the month where the highest number of people requiring an ambulance is recorded.
Unfortunately, Public Health Scotland are yet to publish any further data on the ambulance service past November 2021, but we will most likely find a huge jump in cases again as was seen with people requiring out-of-hours treatment.
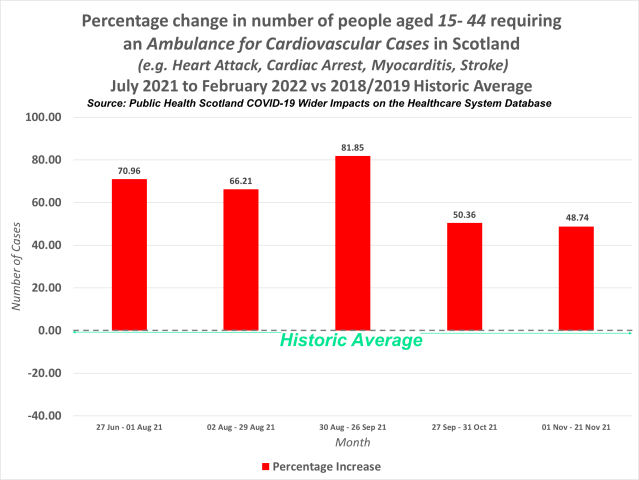
The following chart shows the percentage change in the number of people aged 15-44 requiring an ambulance for cardiovascular cases per month from July 2021 to February 2022, compared to the 2018-2019 historical average per month among the same age group –
The largest increase was again recorded in September 2021, with a 82% increase against the historical average. This was followed by July 2021 which saw a 71% increase and then August 2021 which saw a 66% increase. The lowest percentage change was again recorded in October and November 2021, but these months still saw a 50% and 49% increase.
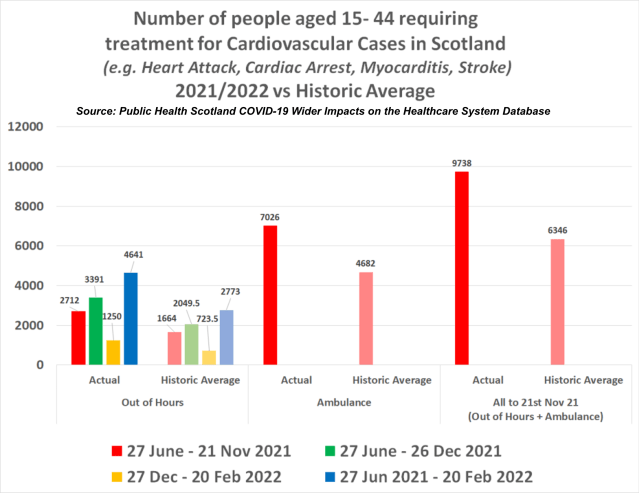
The following chart shows the number of people aged 15 to 44 requiring an ambulance or out-of-hours treatment for cardiovascular cases in different time periods –
What we can clearly see above is the number of out-of-hours cases between 27th June and 21st November 2021, 27th June and 26th December 2021, 27th December and 20th February 2022, and 27th June 2021 and 20th February 2022 compared to the historic average.
As well as the number of people requiring an ambulance between 27th June and 21st November 2021 as well as the historic average. And finally the combined number of out of hours cases and ambulance cases between 27th June and 21st November 2021 compared to the combined historic average.
As you can see 2021 and 2022 has seen substantially more cardiovascular cases among 15 to 44-year-olds in all date-ranges. But what we’re really interested in seeing here is the percentage change compared to the historic average.
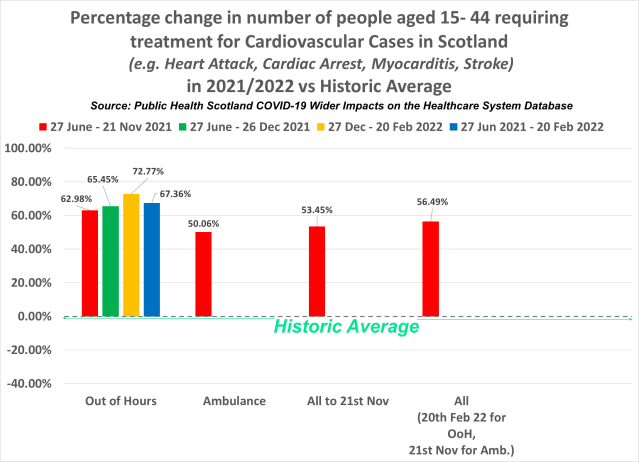
The following chart shows the percentage change in the number of people aged 15 to 44 requiring an ambulance or out-of-hours treatment for cardiovascular cases in different time periods –
Because the ambulance data currently only goes as far as 21st November 2021 we’ve calculated the same time period for out-of-hours cases.
What we can see here is that between 27th June and 21st November, the number of people requiring an ambulance due to suffering a heart attack, cardiac arrest, myocarditis, stroke etc., increased by 50%, whilst the number of out-of-hours cases in the same time frame increased by 63%.
With both ambulance figures and out-of-hours figures combined up to 21st November, we can see that there was a 53.45% increase against the historic average. But when combining the ambulance figures with the full amount of out-of-hours figures up to 20th February 2022, we can see there was a 57% increase against the historic average.
The number of people aged 15-44 requiring out-of-hours treatment for cardiovascular cases between 27th June 2021 and 20th February 2022, saw a 67.36% increase against the historical average. But what we’re most interested in is how the figures for 2022 so far stack up against the figures for the second half of 2021.
The out-of-hours data shows that there was a 65.45% increase in the number of people requiring out-of-hours treatment for cardiovascular cases in the second half of 2021. But the data for 2022 so far shows that things are actually getting worse rather than improving.
The number of people aged 15-44 requiring out-of-hours treatment for cardiovascular cases between 27th December and 20th February 2022 was 73% higher than the historical average in the same time frame.
The big question of course is, why?
Official figure from the Office for National Statistics can most likely answer that question.
he Office for National Statistics is the UK’s largest independent producer of official statistics and the recognised national statistical institute of the UK. It is responsible for collecting and publishing statistics related to the economy, population and society at national, regional and local levels.
Its latest dataset on deaths in England by vaccination status can be found here. It contains a large amount of data on age-standardised mortality rates for deaths by vaccination status between 1 January 2021 and 31 January 2022.
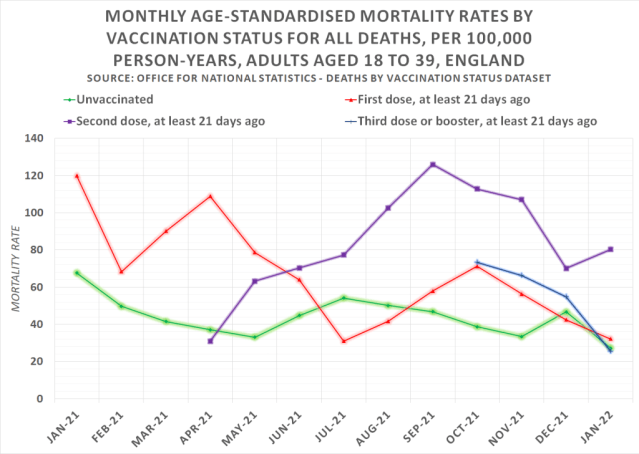
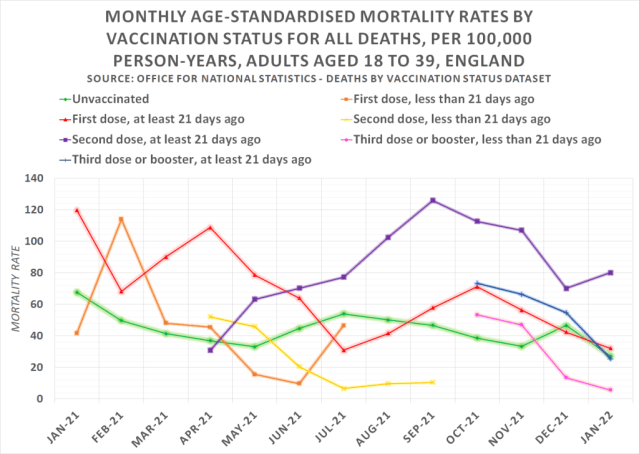
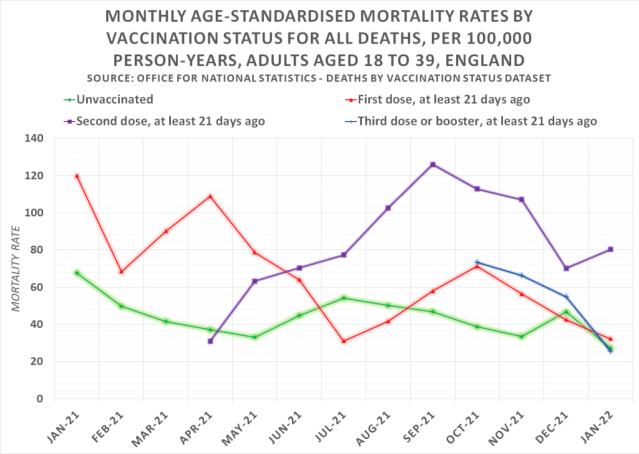
The following chart shows the monthly age-standardised mortality rates by vaccination status for all-cause deaths, per 100,000 person-years among adults aged 18 to 39 in England. The data has been extracted from table 2 of the ONS dataset.
The green line is the mortality rate among the unvaccinated, which while fluctuating has remained pretty stable throughout. The other lines however represent different vaccination statuses, and they are extremely concerning.
The orange, yellow, and pink lines represent mortality rates within 21 days of receiving a first, second or third dose. And they reveal that the risk of death increases significantly immediately after vaccination.
But the most concerning figures are the mortality rates among those vaccinated at least 21 days ago, which you can see more clearly in the following chart –
Around June 2021, there is a cross over from those who’ve received one dose to those who’ve received two doses in terms of the increased mortality rate against the unvaccinated. This obviously tallies with when each injection was administered to this age group. But what’s most concerning here is that the second injection seems to make things much worse in terms of the risk of death.
In January 2021 the mortality rate per 100,000 person-years among the unvaccinated equated to 67.7. This then fell month on month to 33.1 in May, before increasing again in June to 44.8. The same however cannot be said for those who had received a single dose at least 21 days prior to their death.
In January 2021 the mortality rate per 100,000 person-years among the partly vaccinated equated to 119.9. Meaning the mortality rate was 77% higher than the mortality rate among the unvaccinated. This then fell to 68.3 deaths per 100,000 in February, before climbing to 90.1 in March, then 108.8 in April.
This means at this point the mortality rate among the partly vaccinated was 193.3% higher than the mortality rate among the unvaccinated. But not long after following the second dose being administered things get even worse.
The highest mortality rate among the double vaccinated (at least 21 days ago) occurred in September 2021, with 125.9 deaths per 100,000 person-years. In the same month, the mortality rate among the unvaccinated equated to 46.8. Meaning the double vaccinated mortality rate was 169% higher than the unvaccinated mortality rate.
But the largest statistical difference occurred in November 2021. The mortality rate among the unvaccinated equated to 33.4 deaths per 100,000 person-years, whereas the mortality rate among the double vaccinated equated to 107. A difference of 220.4%.
With –
Myocarditis; an autoimmune condition that causes inflammation of the heart, being a known side-effect of the Covid-19 injections,
Data showing a 73% increase in the number of people aged 15 to 44 suffering heart attacks, cardiac arrest, myocarditis, stroke, and other cardiovascular diseases since this age group was first offered the Covid-19 injection,
And further data showing fully vaccinated young adults are on average 92% more likely to die than unvaccinated young adults.
It would appear we have the smoking gun that proves the damage the Covid-19 injections have done and are doing to the population.
Do NOT comply.



Wow, amazing work.
Great article as usual! The question is how to fix this problem. First, the vax injuries need to be admitted. Then solutions can be sought. In the meantime an article written in 2020 may offer some hope for the vax poisoned regarding cardiovascular disease. High dose vitamin D helps maintain the integrity of vascular epithelial cells by preventing inflammation...maybe vitamin D would help with myocarditis or pericarditis. https://m.theepochtimes.com/vitamin-d-can-mend-a-broken-heart_3399060.html